Initial system
V1.0
Period
2017-2018
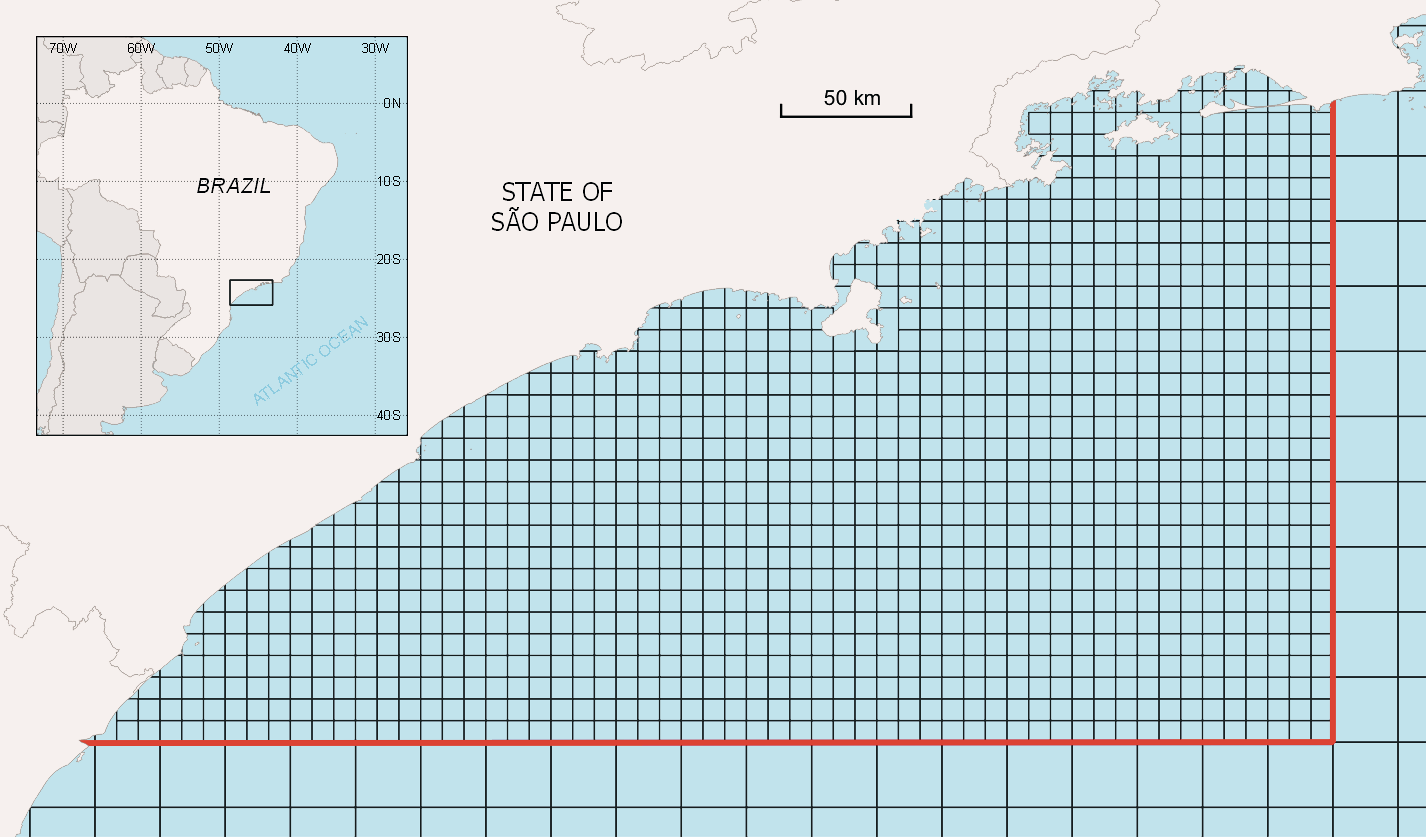
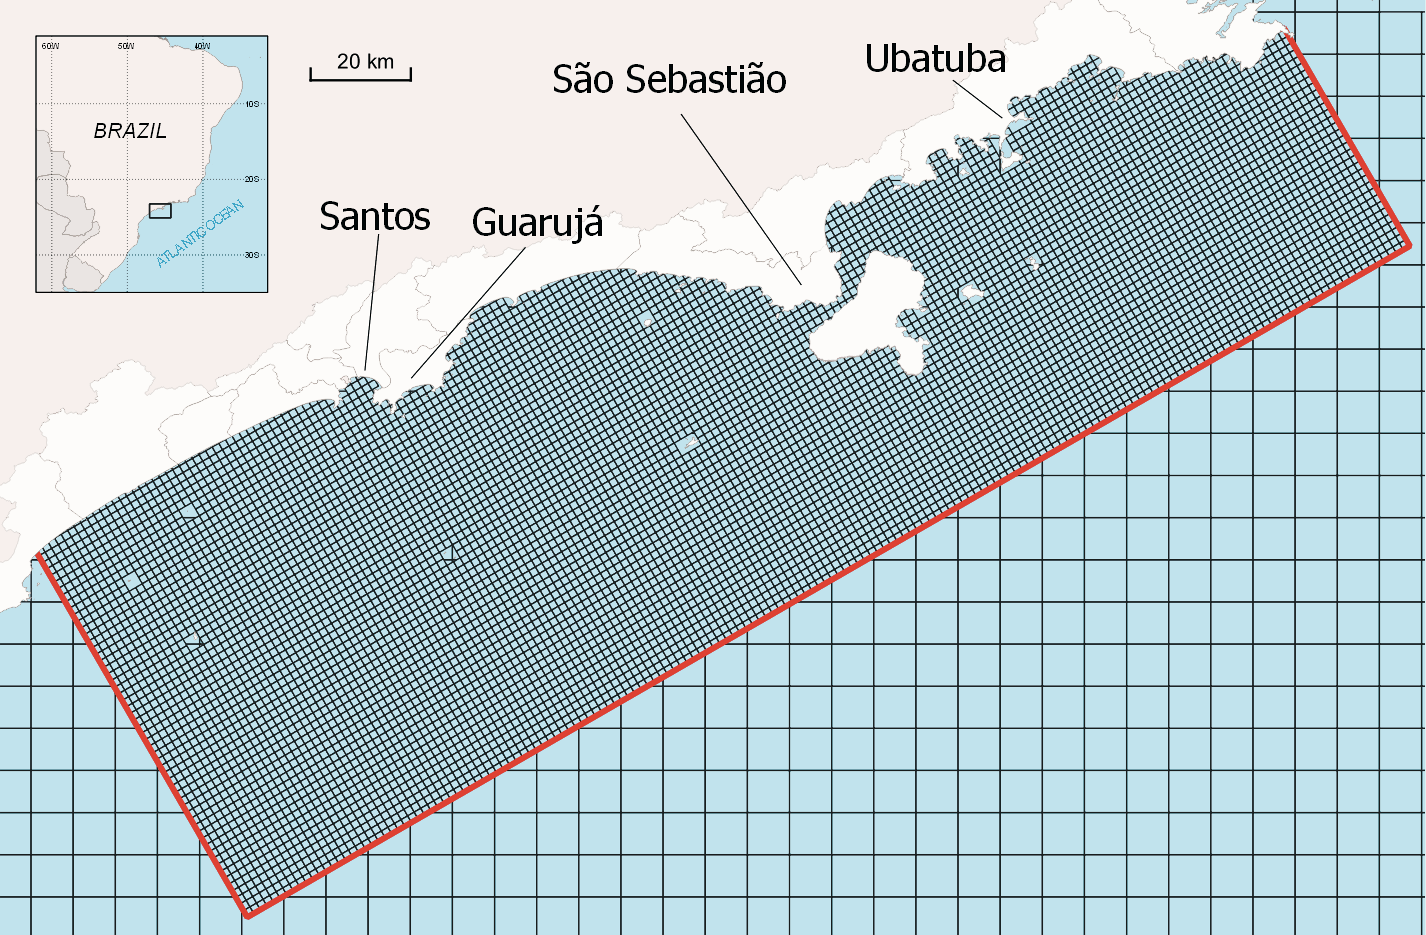
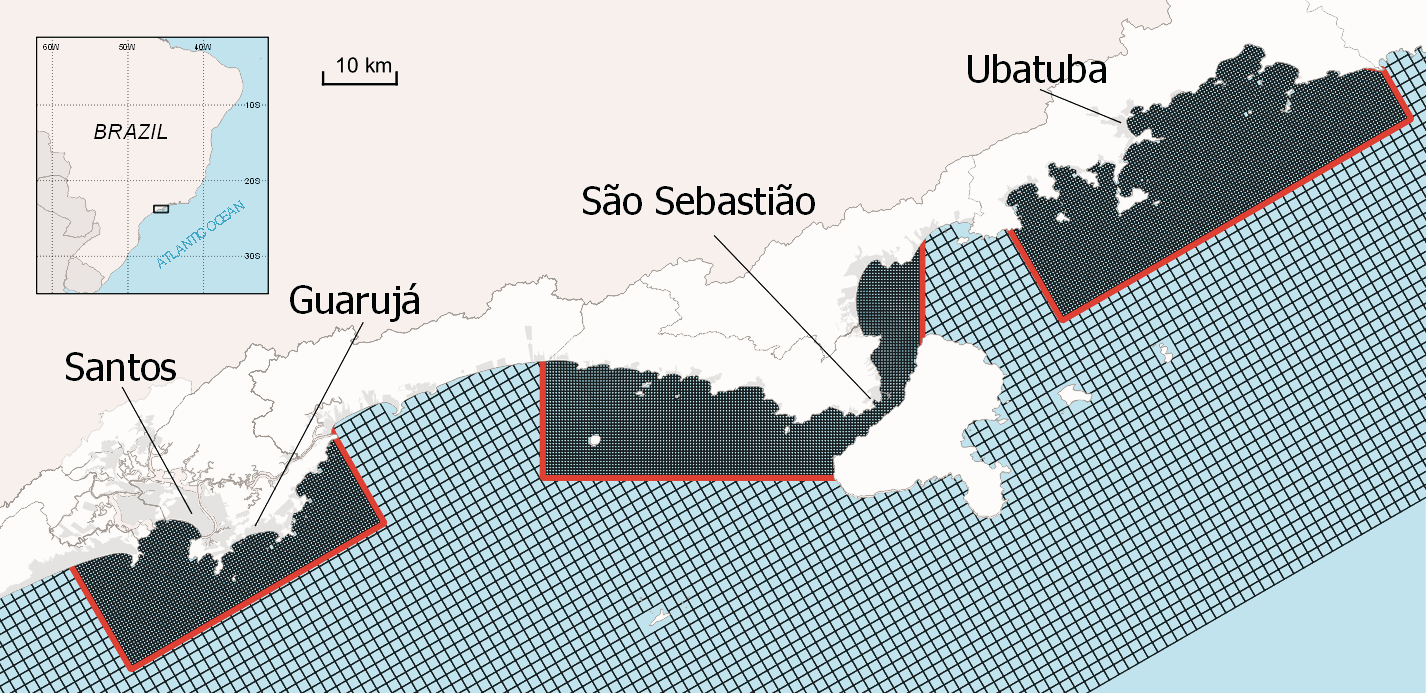
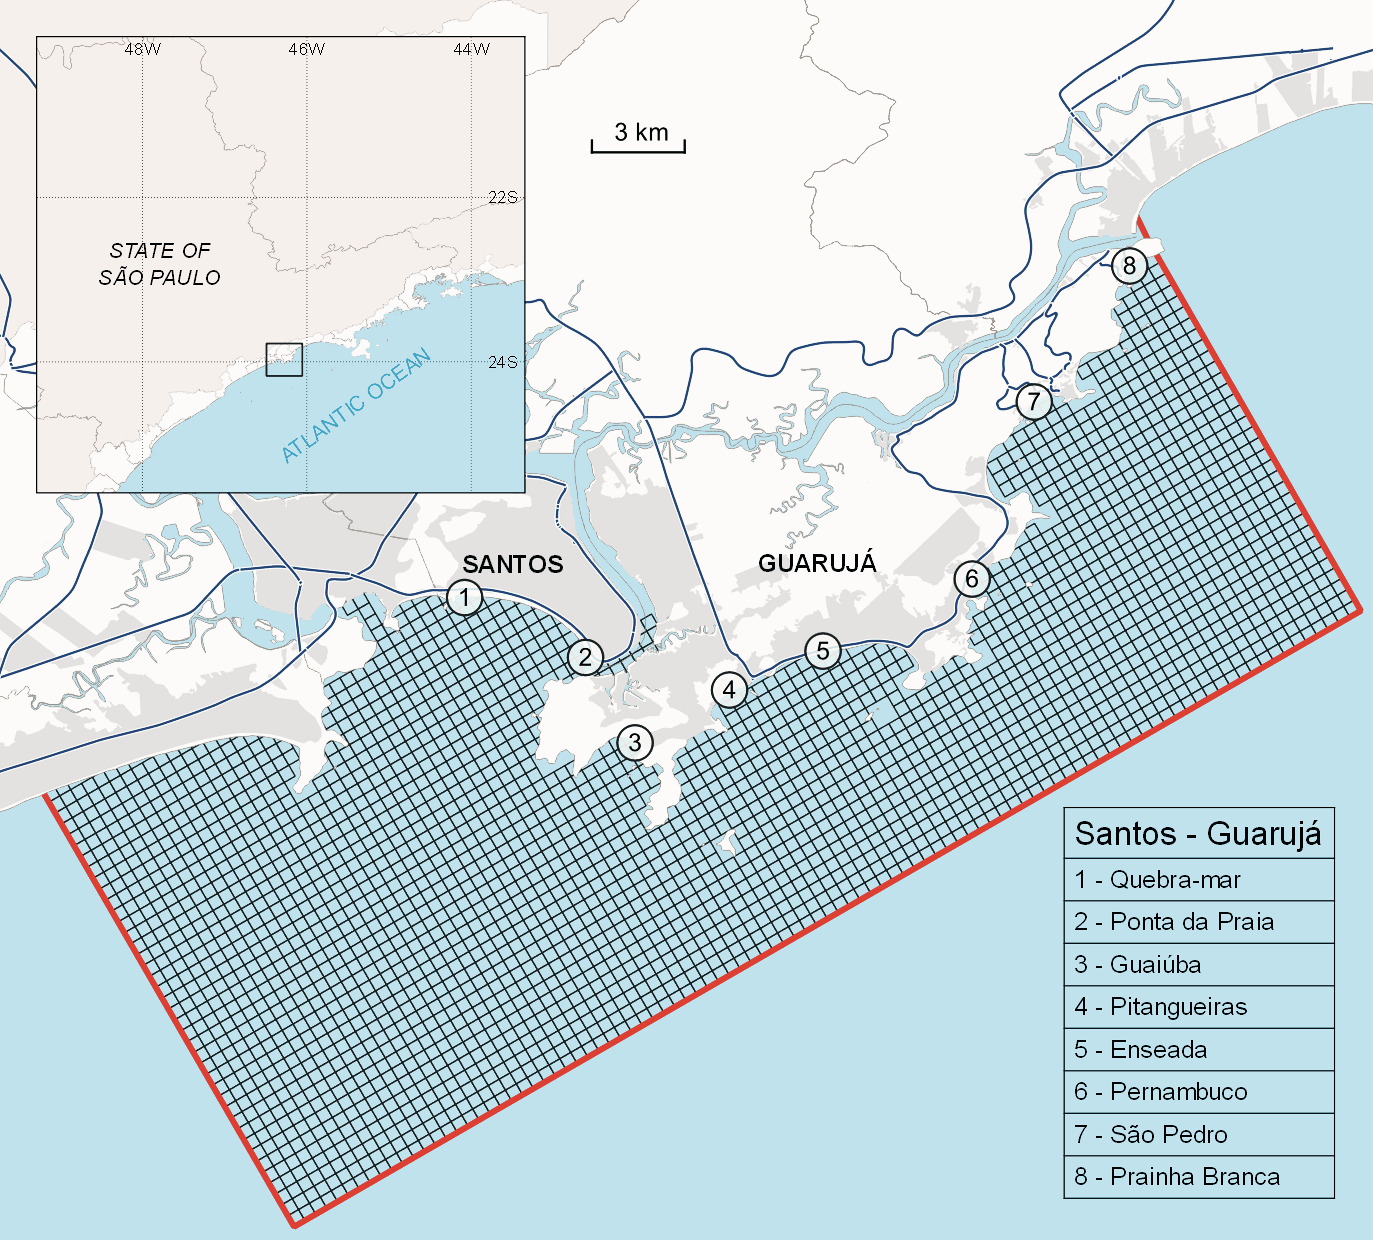
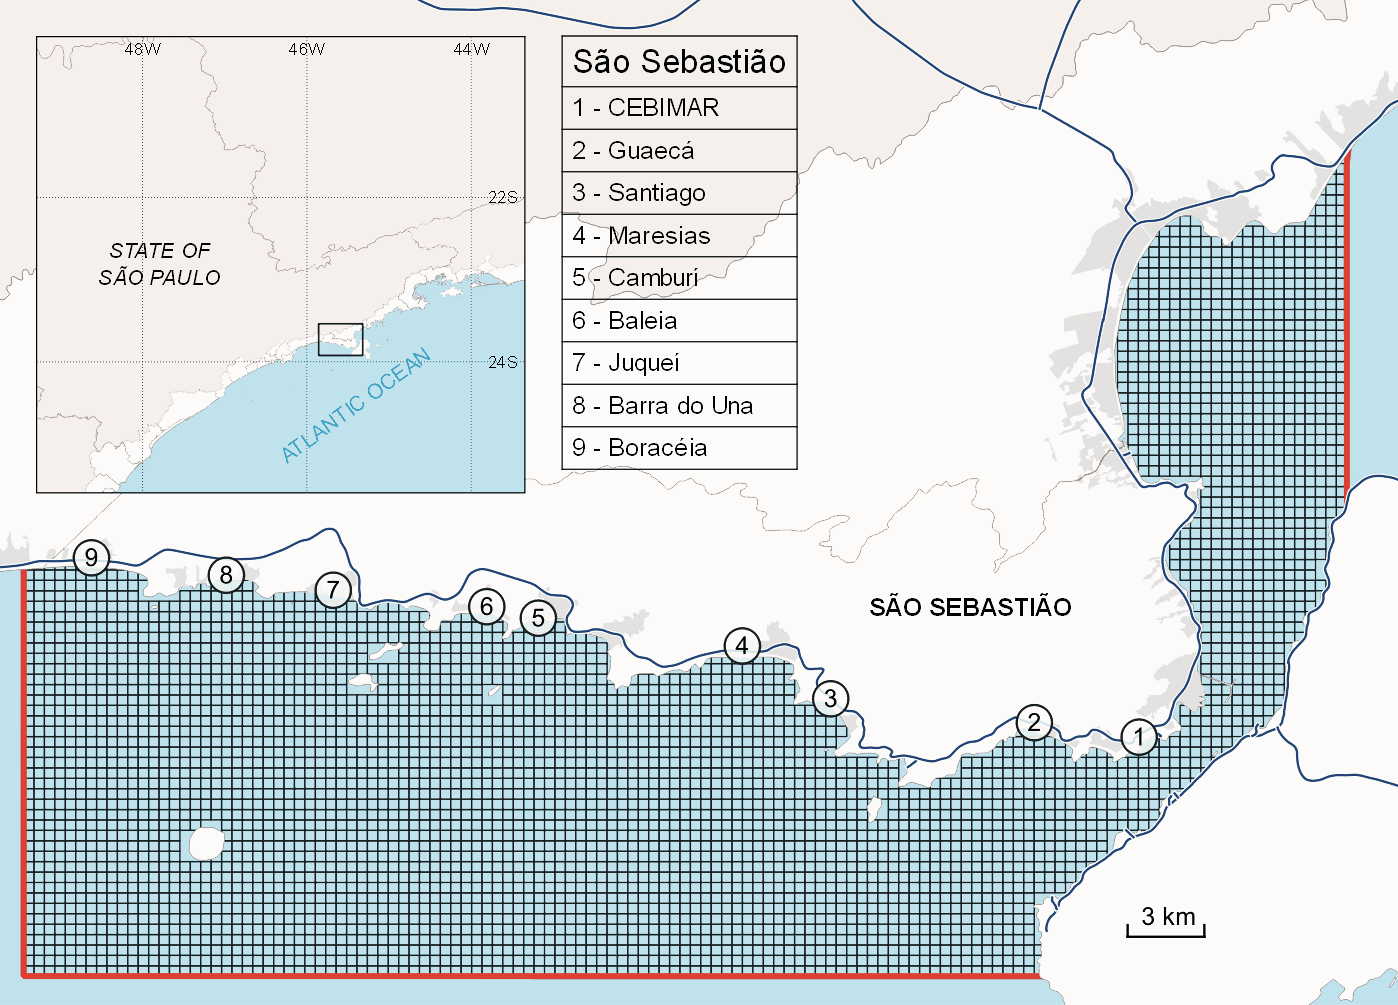
Coverage
Guaecá Beach and the São Sebastião/Ilhabela area.
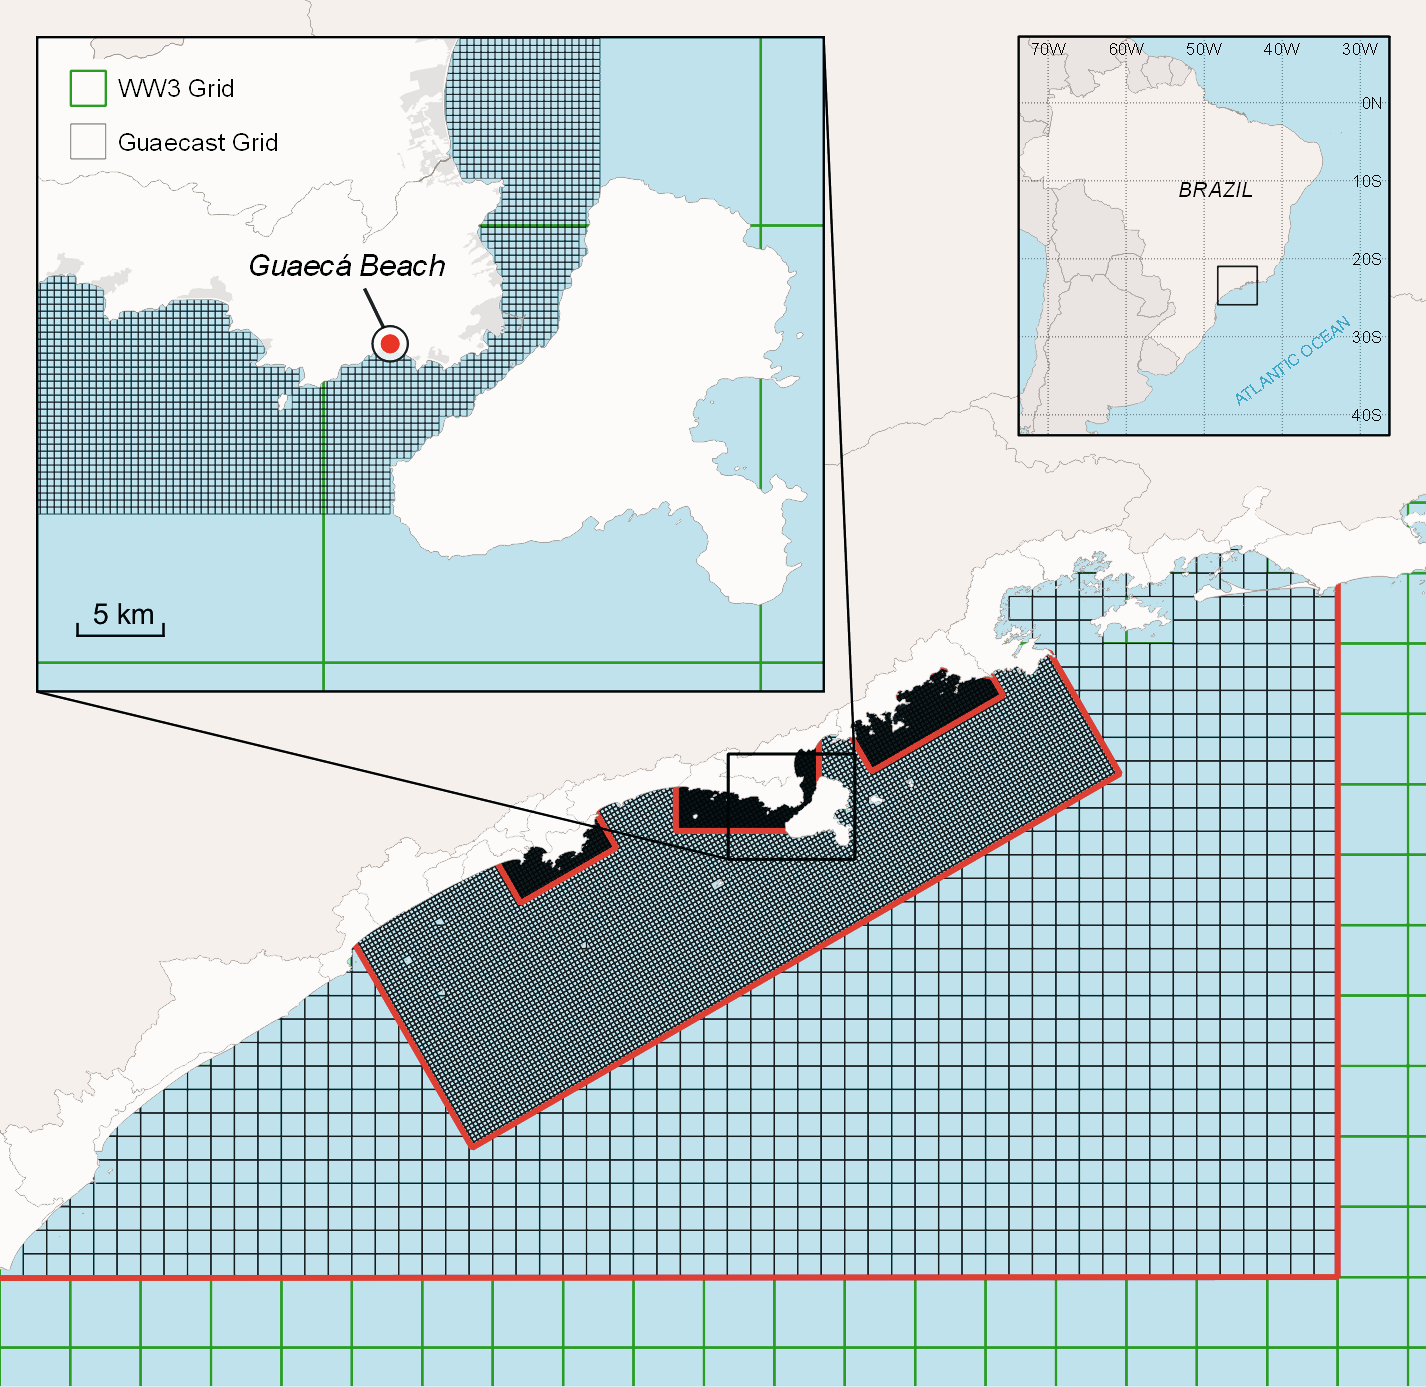
Model setup
SWAN nested inside NOAA WaveWatch III.
Grid structure
One high-resolution coastal grid focused on the original study area.
Forecast range
7 days, mainly during larger-swell seasons.
Main contribution
Validated the nested approach for local wave forecasting.